Introduction
The fishbone diagram, also known as the Ishikawa diagram, is a cause and effect diagram. This tool helps to identify potential causes and find the root cause of a specific problem. Furthermore, then it helps in identifying, analyzing, and improving quality issues. Sometimes it can also be useful to identify what can go wrong to avoid potential problems in the future.
Definition of a Fishbone Diagram
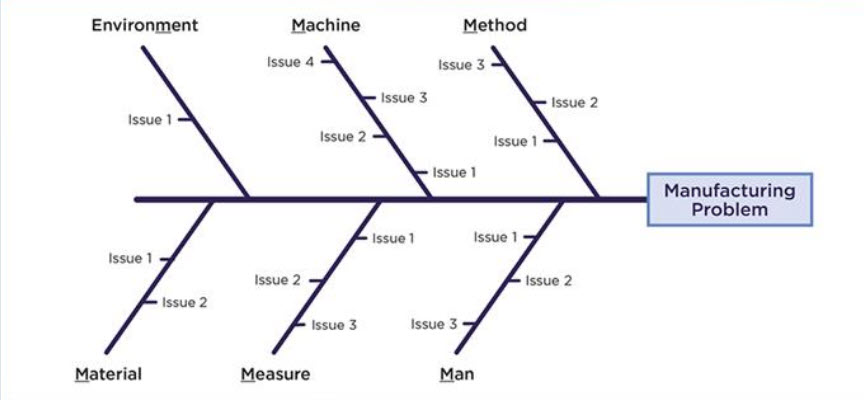
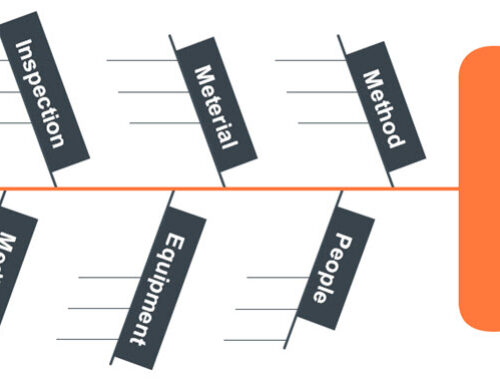
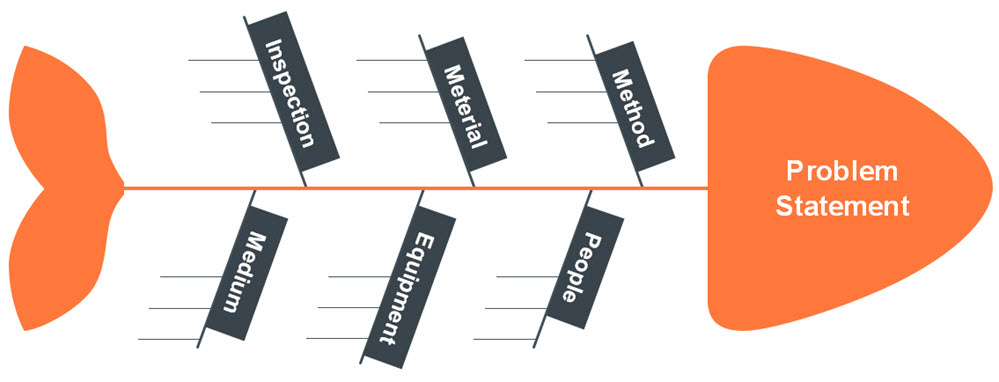
The fishbone diagram has the shape of a fish skeleton. It has the problem defined in its head and the causes of the problem feeding into the spine. Once all causes have been identified that underlie the problem, they can be prioritized and the most likely items can be investigated further to ensure that the problem doesn’t reoccur.
The “head” of fish which represent the problem is often shown on the right side. The extended bones on left side show the various causes. The ribs depict the categories of causes for analysis, which branch out into the causes and sub-causes. The level of branching depends on the requirements under each category. The most commonly used is defined as the 6 M’s concept which include the following:
- Man
- Machine
- Material
- Method
- Measurement
- Mother Nature / Environment
Similarly, many marketing industries follow the categories of 7 P’s as seen below for the definition of a fishbone diagram:
- Product
- Price
- Place
- Promotion
- People
- Positioning
- Packaging
Drawing a Fishbone Diagram
- First, draw the head on right side that containing the problem (issue/effect) for analysis.
- From head side draw straight line to left side which is going to be the backbone of the fish.
- Find the areas, higher-level categories, to be sorted and branch them on the backbone. E.g. 6 branches if the 6M’s are used.
- Examine the causes from the categories which contribute to the effect or problem. Interconnect examined causes with the category branches.
- Break-down the causes into the sub causes until they have been fully exhausted, often a tool called 5 whys is used for this.
Uses of Fishbone Diagram
A fishbone diagram has several uses, these can be, but are not limited to the following:
- Identify a potential problem in new product design.
- Preventing quality defects on products and services.
- Identify potential impact of a change.
- Identify and eliminate causes of problems.
Analysis of Fishbone
Diagrams of fish bones are used in analyze phase of the DMAIC (Define, Measure, Analyze, Improve and Control) process. This methodology is used for Lean Six Sigma type of problem-solving technique. This diagram is also used together with a 5 why analysis used to drill down to the root cause of the problem from the defined causes.
Fishbone Diagram Procedure
The procedure for developing fishbone diagram is often a team exercise. The first step is the identification of problem. Once the problem is identified, there is place for brainstorming sessions, that could be in a group or individual to identify causes. The people who are involved must share the possible causes of that effect.
Step-by-Step Process to Find Causes
- First, recognize the problem that must be analyzed.
- Set up the categories of causes for the analysis. E.g., considering the categories of 6M’s, the following questions are required to ask:
- Man: Whether people/workers causing to problem?
- Machine: How the problem can be related to machines?
- Method: What flaws in method associated that is causing the problem?
- Measurement: If the tools or standards having errors that need correction?
- Material: What changes in the material’s properties have occurred?
- Environment: What were the conditions of the environment (temperature, pressure, etc.)
- Further, drill down by asking 5 why’s at the initial level of causes.
- Note down these cases against the main categories.
After all potential causes and possibilities are identified, these causes are rated. The rating must be based on impact of causes on the effect. Rating will judge the criticality and importance of causes and prioritize them. As per the top rating, the solutions are proposed.

