Problem-solving in business and project management often requires more than simply identifying symptoms; it demands uncovering root causes. One of the most popular tools for achieving this is the fishbone diagram, also known as the Ishikawa diagram or cause-and-effect diagram. While drawing one from scratch can work, having a ready-made and efficient fishbone diagram template can significantly streamline the process.
A well-designed template not only saves time but also ensures that your analysis is structured and comprehensive. This article explores the importance of an effective fishbone diagram template, the steps to develop one, and tips for maximising its usefulness.
Understanding the Purpose of a Fishbone Diagram
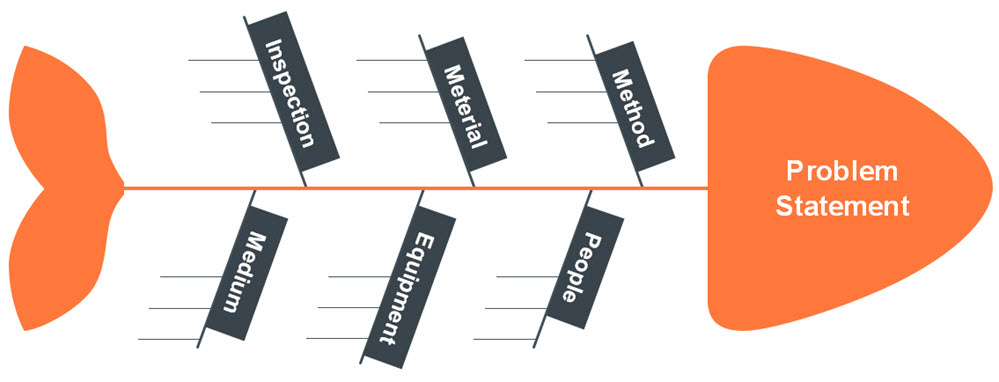
Before creating a fishbone diagram template, it’s essential to understand its purpose. This visual tool is used to systematically identify, explore, and display all possible causes of a particular problem or effect.
The diagram’s structure resembles the skeleton of a fish.
- The “head” represents the main problem or effect.
- The “spine” runs horizontally, connecting the head to the diagram’s framework.
- The “bones” branch off the spine, representing categories of potential causes.
- Smaller “sub-bones” represent more detailed causes within each category.
Common cause categories include.
- People: Human factors such as skills, training, or staffing levels.
- Processes: The steps and workflows involved in delivering the output.
- Equipment: Tools, technology, or machinery used in the process.
- Materials: Raw inputs or resources.
- Environment: External conditions or workplace environment.
- Management: Leadership, policies, and decision-making.
A well-prepared fishbone diagram makes it easier for teams to brainstorm, visualise, and prioritise possible root causes before deciding on solutions.
Designing an Efficient Fishbone Diagram Template
Key Elements to Include
When developing a fishbone diagram template, clarity and usability are paramount. An effective template should include.
- A clearly marked head: A dedicated space for writing the problem statement in precise terms.
- Primary category branches: Pre-labelled branches for common cause categories, with room for customisation.
- Secondary cause spaces: Lines or boxes branching off the main categories to capture sub-causes.
- Sufficient writing space: Adequate room for notes, keywords, and potentially colour coding.
- Guidance notes: Brief instructions to help users navigate the brainstorming process.
By incorporating these elements into a fishbone diagram template, you ensure that anyone, regardless of prior experience, can use it effectively.
Choosing the Right Format
The format of your fishbone diagram template will depend on your organisation’s needs.
- Digital templates: Useful for remote collaboration. These can be created in tools such as Microsoft PowerPoint, Excel, or online whiteboards like Miro and MURAL.
- Printable templates: Ideal for in-person workshops, allowing team members to physically write on them during brainstorming.
- Interactive templates: Designed for use in specialised software, enabling drag-and-drop causes and real-time updates.
When developing your template, consider who will be using it, how often it will be updated, and whether it needs to be compatible with other reporting tools.
Best Practices for Using a Fishbone Diagram Template
Start with a Clear Problem Statement
A fishbone diagram is only as useful as the clarity of the problem it addresses. The first step is to define the problem in a concise, measurable way. Ambiguity at this stage can lead to unfocused brainstorming and irrelevant causes.
Encourage Diverse Input
A fishbone diagram template works best when filled in collaboratively. Include team members from different departments or with varied expertise to capture a broad range of perspectives. This helps ensure that the diagram reflects all possible causes, not just the most obvious ones.
Use the “Five Whys” Technique
Once potential causes are listed, use the “Five Whys” method to dig deeper. For each cause, ask “Why does this happen?” repeatedly until you reach the root cause. Your fishbone diagram template should allow space to add these deeper insights.
Keep It Organised
While brainstorming can be fast-paced, it’s important to keep the diagram legible and logically structured. This makes it easier to analyse later and ensures that important details aren’t overlooked.
Advantages of an Efficient Fishbone Diagram Template
An efficient fishbone diagram template offers several benefits:
- Time savings: No need to create a diagram from scratch for each problem-solving session.
- Consistency: Standardised categories and layout make it easier to compare different analyses.
- Collaboration: A familiar structure helps teams work together more effectively.
- Comprehensive analysis: Encourages consideration of all possible causes, reducing the risk of overlooking critical issues.
- Ease of documentation: The completed template becomes a clear record of the problem analysis process.
By standardising the structure, your organisation can focus more energy on the actual analysis rather than the logistics of diagram creation.
Conclusion
Developing an efficient fishbone diagram template is an investment in better problem-solving. By creating a clear, user-friendly structure, you give your team the tools they need to uncover root causes quickly and effectively.
Whether you choose a digital, printable, or interactive format, the key is to ensure that your fishbone diagram template is flexible enough to adapt to different problems yet structured enough to guide users through the process. In doing so, you not only save time but also enhance the quality and consistency of your analysis, ultimately leading to better decisions and stronger results.

