Description
Root cause analysis is often the progressive approach taken up by many organizations, willing not only to survive but to thrive at the same time. Identifying what the real issue is behind a problem holds the key to the success of an organization. Many organizations put together a separate team to investigate the causes that hinder their effectiveness. However, it is often outsourced to some consulting company to eliminate any shadow of biasedness in the findings. But the question is which analysis tool to pursue?
Root Cause Analysis Diagram
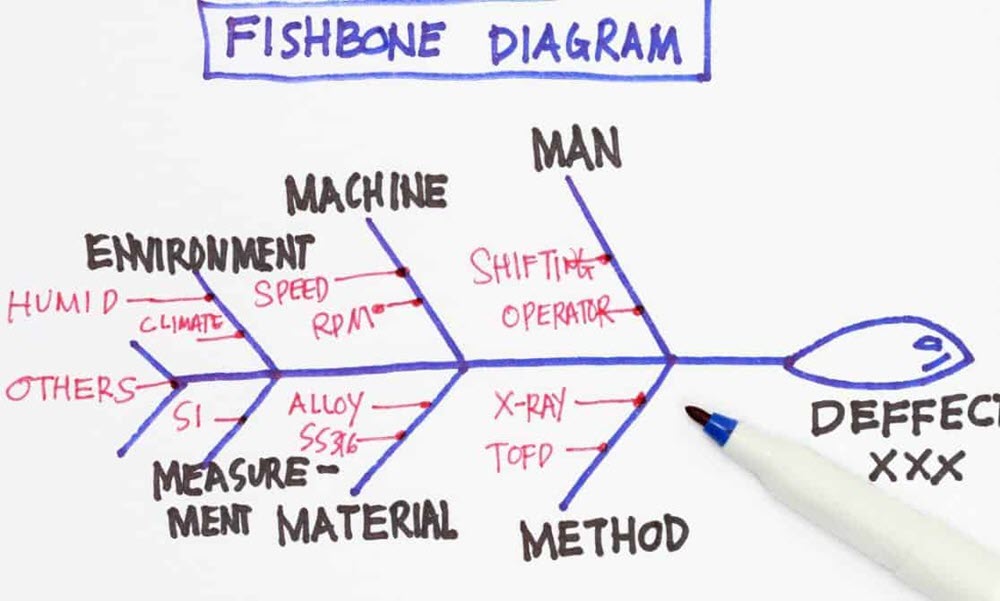
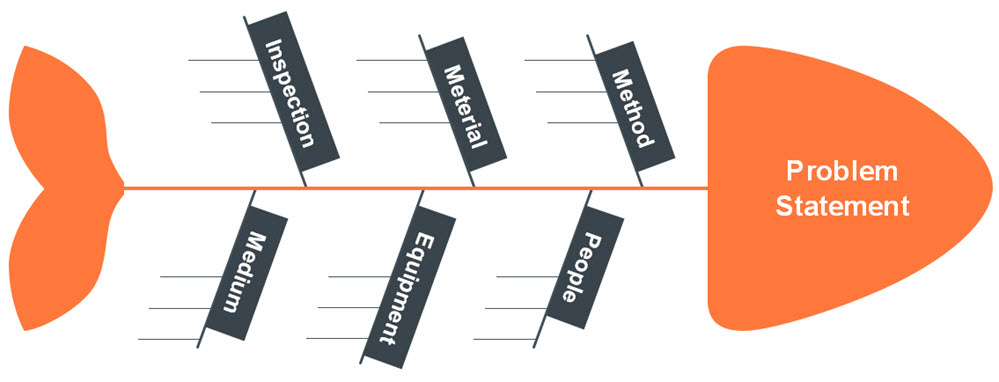
The fishbone, also known as the cause-and-effect diagram, is often the preferred choice as the root cause analysis diagram. This is due to the diagram offering a viable solution to finding not only the high-level causes to the problem (effect) but also scratch deeper to find where the real issue lies (root cause). Not to mention other analysis tools for root causes like the 5 Why’s which is a rigorous procedure, or the Failure Modes and Effects Analysis (FMEA) which is quite systematic. However, the Fishbone diagram serves the best of all worlds in that the overall procedure becomes quite user-friendly and soul-searching becomes bit of a fun task.
Fishbone Analysis
A root cause analysis based on a fishbone diagram, often takes place in a brainstorming sort of activity, meaning it’s a team task. This is especially ideal for organizations involving a variety of departments like Research & Development, Quality Control, and Maintenance. Representation of each in the brainstorming activity allows for enhanced results at a quick pace.
Execution of a Root Cause Analysis
Following procedure is often adopted when using the fishbone as a root cause analysis diagram:
- The starting step is usually identifying the problem, the effect. Best practice is to be as specific and concise as possible for better and quick results. Avoid giving any indication of where the cause may be, even if a general idea is known. Example, consider the problem statement, “Yearly turnover report shows decline in the quality of product” or “Yearly report indicates decline in product quality, R&D department can really boost our sales.” On the outside, one may be tempted to pick the 2nd statement, however it really states the problem lie with the R&D department. A big NO in the problem statement!
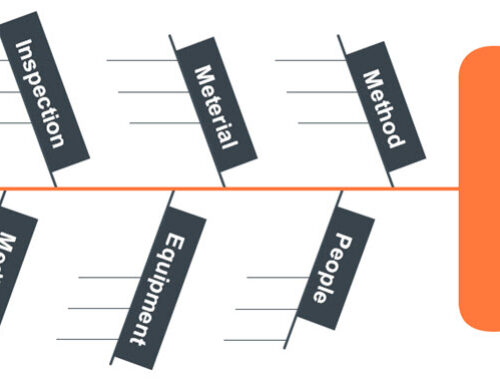
- Brainstorm and get to the major causes that resulted in the said problem. Was it poor research behind the decline in quality? Did our policy play a role in the decrease in sales? Is the equipment present good enough? These and many more questions surface major causes. The 6 M’s namely Man (Personnel), Mother-nature (Climate, geography), Maintenance, Methods (Policies/Procedures), Machine (Equipment) and Material (Raw material) offers general outline for causes. However, sometimes they are grouped as:
- Environmental Factors
- Equipment & Supply Factors
- Rules/Policies
- Personnel
- The 5 Why technique is the norm to be utilized in fishbone root cause analysis diagram where ‘Why is this’ carries the discussion. Each idea presented is met with the why question so that more and more in-depth searching can be done. With a well-focused team, brainstorming this way allows quick identification of the root cause in a not so challenging way.
Construction of a Fishbone Diagram
The problem statement(effect) is usually placed at the head/mouth of the fish. The major cause categories are listed at the ends of bones. A good practice is to leave some space in between the bones to ensure the causes are highlighted and the root cause analysis process is visually appealing at the same time. Sticky notes can be passed to the team members who are encouraged to openly write down what is on their mind without judgement. The Fishbone diagram along with 5 why’s analysis yields good quantifiable results once all members get exhausted of more ideas. Often, a voting pattern is adopted to ensure all team members give their opinion for the root cause and are on the same page so as to say.
Final Remarks
Root cause analysis is an important management tool to ensuring any problem that surfaced gets corrected without much damage. It also highlights how effective current practice are. This way, any present or future problem that can occur is predicted and suitable controls can be implemented to avoid it from happening. Fishbone diagram is an efficient method of doing just that! It not only is rigorous in approach to get to the root cause of an issue, but at the same time is a fun activity that ensures a progressive working relation among the team and thus, the organization.
