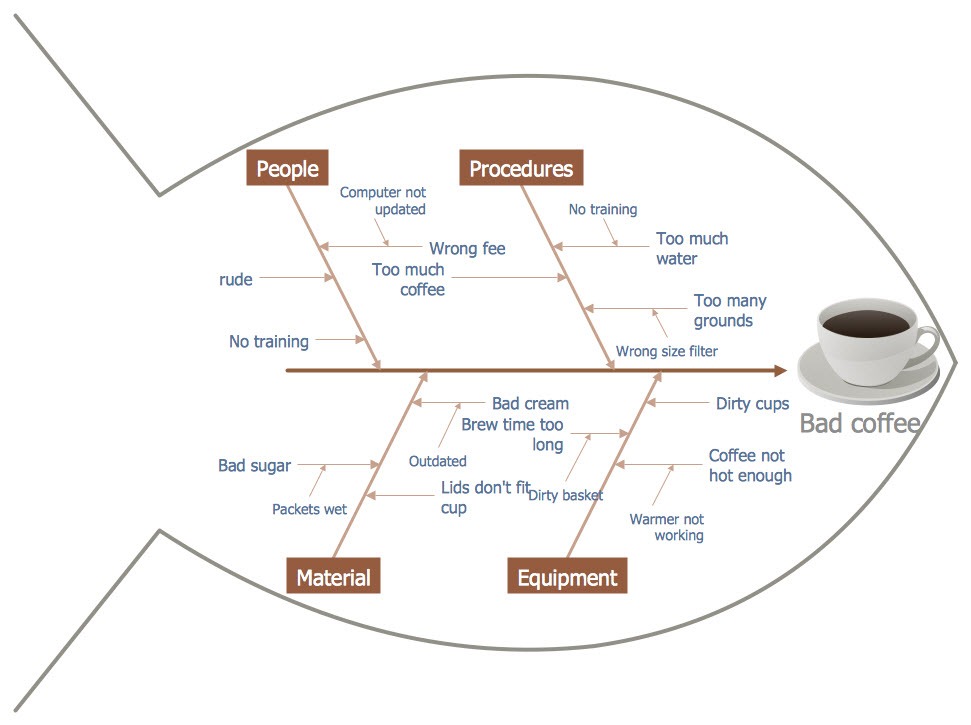
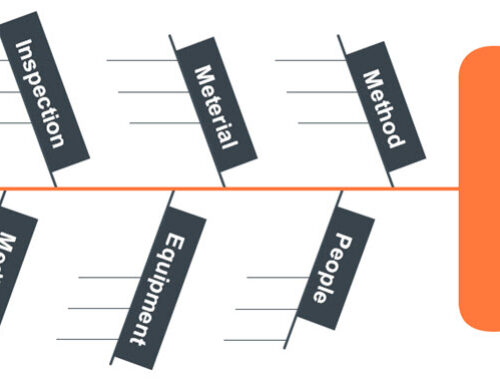
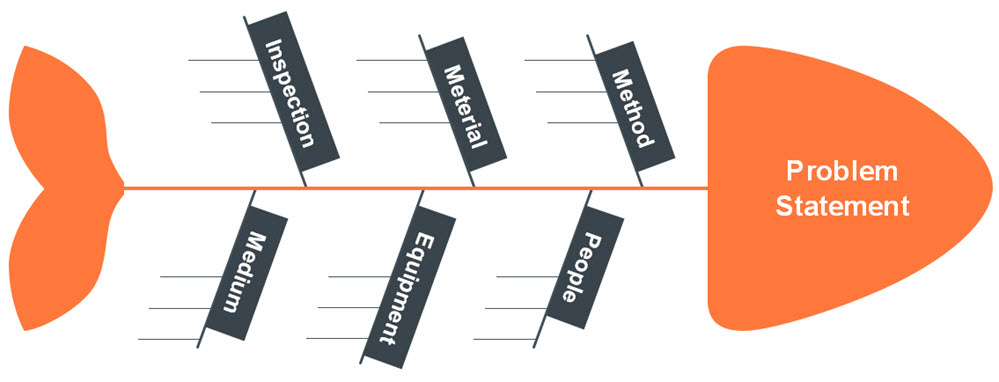
Let’s start with looking at what a fishbone diagram is. The fishbone diagram is a basic graphical presentation which shows every of the possible cause of a particular problem. This diagram is also referred to the cause and effect diagram, the herringbone diagram well as the Ishikawa.
The fishbone for problem solving was invented by a Japanese professor called Kaoru Ishikawa in the year 1960. Kaoru Ishikawa is a highly respected specialist in quality management and of course the diagram itself looks like a fish. For this particular reason, it is hence popularly called a fishbone diagram.
The fishbone for problem solving helps explore whatever might be causing a particular problem. It is essential to identify the actual cause of a problem before trying to figure out how to solve the problem.
When making use of the fishbone for problem solving, it provides a complete list of probable causes for the identification of the root cause of a problem. The very first advantage of the fishbone is to give a better comprehension of the problem and therefore, the root cause of the problem can be gotten rid of in one shot instead of solving the problem bit by bit.
To identify the root cause of a problem and come up with a mind map that graphically displays all the identified causes, the fishbone makes use of a brainstorming strategy to gather the causes. On occasions, the most obvious cause might turn out to be a minor one and the one thought to be minor could be the major cause. To avoid this error, making use of the fishbone for problem solving gives the chance to thoroughly think about the root cause of a particular problem thus, leading to a more robust resolution.
The fishbone forces one to consider every probable cause of a problem rather than only paying attention to the most obvious cause.
Benefits of Using Fishbone for Problem Solving
Fishbone diagrams are valuable because they help to display information in an understandable and neat manner. Below are 5 primary benefits of making use of fishbone for problem solving.
To Display Relationships Reasonably and Visibly
The fishbone captures the relationships and links among the probable causes and outcomes shown in the diagram. The correlation can then be comprehended at a glance when categorized reasonably.
Simultaneously Show Every Possible Cause
Any cause displayed on the fishbone diagram could be a possibly lead to the particular problem. The fishbone describes every probable reason in a diagram and this is valuable for in-depth analysis. This capability increases the usefulness of the fishbone for problem solving for stakeholders.
Involves Team for Brainstorming
A fishbone diagram is a great way to structure and boost team brainstorming about reasons of some particular outcomes because it captures every of the causes.
Input for Solving Problems
The team assigned to find out probable solutions to every problem might be stimulated after seeing the reasons in the graph and discovering the root cause.
To Maintain Team Focus
The fishbone helps keep the team focused as discussions are had on what to be done to find solution to a problem or achieve a particular goal. It also helps to make sure that no one is wasting energy pursuing problems that are not existing.
Some other advantages of using fishbone for problem solving are;
- Ease of comprehension and analysing.
- It assists in preventing team members from quarrelling and putting blames on each other because of an arising problem.
- It assists in identifying the various ways for improving the process.
- It helps in the identification of the root cause of a problem.
- It helps to prioritize further analysis and take the necessary corrective actions.
- It assists in identifying the bottlenecks in processes.
Conclusion
The fishbone is a very essential tool in the identification of the root cause of a particular problem. Though, it is usually time consuming to develop this diagram, the benefits of making use of a fishbone for problem solving are however, very huge. In recent times, the cause and effect diagram is being made use of in every industry including production, project management, marketing, manufacturing and many others.

