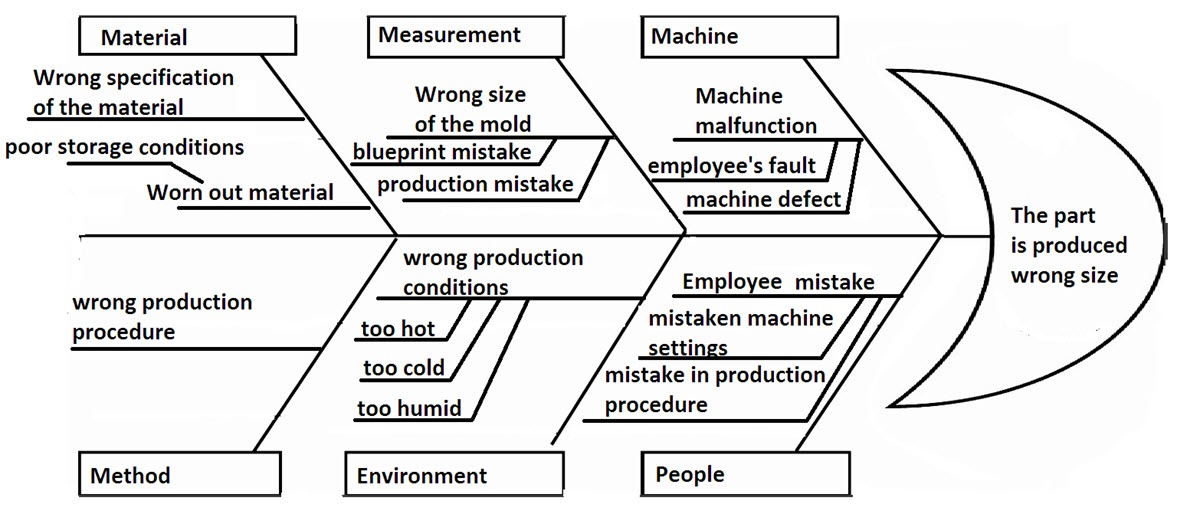
Problems are a part of any business and they can occur at different times as well as in various different forms. The main thing is that we possess the potential to identify the cause of these sorts of problems in a suitable way. In simple words, a fishbone diagram is a diagram that looks like a fish skeleton. It’s sometimes referred to as a cause and effect diagram as well based on what it is used for. The problem being considered is known as the effect and the causes is what you are trying to find with it. This diagram visually maps out the potential causes of a the problem or an incident being analyzed.
Purpose of a Fishbone Diagram
A fishbone diagram is also called a Ishikawa diagrams since this diagram was initially developed at the University of Tokyo by Dr. Kaoru Ishikawa in 1943. Some other names of this diagram are known as “Herringbone diagram” and “Fishikawa diagram”. Interestingly, this cause analysis tool is one of the seven fundamental tools of quality. More to point, it has turned out to be a significant measure of several present-day systems, containing Six Sigma. At first this tool was considered to help in solving the main problem. However, the fishbone diagram serves the purpose that goes beyond than simple problem solving. It facilitates us in being able to break down its every contributing element in a hierarchical style.
How to Create a Fishbone Diagram
A fishbone diagram must be used when we have to determine possible causes of a problem and when the team’s thinking working on the problem tends to feel stuck.
Steps to Create a Fishbone Diagram
In order to create a fishbone diagram, we have to go through some key steps.
- The first step is to identify the problem that needs to be solved. Now at the mouth of the “fish” we write down this problem. It must be kept in mind that we have to be very clear and precise about the chosen problem. Look out for stating the problem in term of an answer, for instance, we must have something more. This diagram can be drawn on a single paper sheet, or it can be drawn on a white board if this is conducted as a team activity.
- The second step is to diagnose the main classifications of reasons that result in the problem which are stated as branches spreading from the diagram’s arrow. Usually the key classifications consist of: material, measurement, Machine, Method, person and environmental factors. At this stage, we have to brainstorm every possible cause that can be a leading factor of the problem. We must ask “Why does this take place?” The causal factor is written by the facilitator as a branch from the suitable class and placed on the fishbone diagram when each idea is presented. The possible causes can be written in different places if they fall under different classifications.
- The third step is to discover “Why does this take place?” about all possible causes. After that the sub-causes branching off the possible cause branches are written. These why factor will then turn into branches as well as sub-branches. The branches are drawn facing toward the spine, and the sub-branches facing in the direction of all relevant branches. It is more suitable to alternately use post-it notes rather than writing the possible causes directly on the fishbone diagram when this activity is conducted by a team. It provides us the opportunity to transfer the proposed causes from one place to another when required, and to shape the information while the brainstorming activity is conducted by the team. Now coming back to our main problem, we must keep digging causes and sub-causes as well in an organized way that clarifies the why factor to the possible causes. It must be continued unless we can’t think of any additional likely causes.
In the end this cause and effect analysis will provide an organized way for us as well as our business to understand every potential cause of a problem and makes it easy to determine a solution. This finalized fishbone diagram can be inserted into any presentation or report. Once the fishbone diagram is completed, we can export or print it out to different file formats so it can be shared with others.


