3 sigma control limits is used to check data from a process and if it is within statistical control. Thisis is done by checking if data points are within three standard deviations from the mean.
When we talk of statistical control using 3 sigma control limits, we use the three sigma limits to set the control limits (Lower and Upper) using statistical charts such as for example Microsoft Excel. These control charts help us establish limits for business processes that require statistical control for the operations.
The three sigma quality system is based on analysis and statistical process control (SPC). Three sigma statistical process control methods enable business process to be manageable and stable.
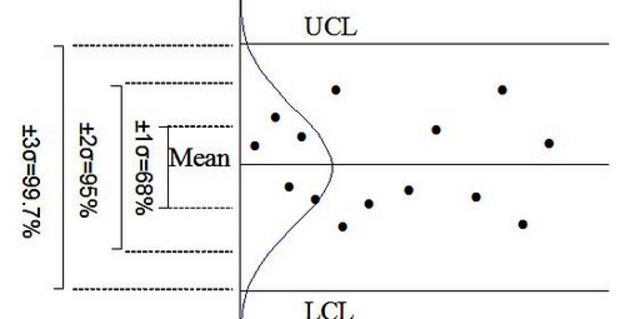
In statistical process control, there is a upper control limit (UCL) and a lower control limit (LCL) set. The UCL is set three sigma levels above the mean and the LCL is set at three sigma levels below mean. Since around 99.99 percent of a controlled process will take place within plus or minus three sigmas, the data from a process ought to approximate a general distribution around the mean and within the pre-defined limits.
Example: You are setting up a statistical process control for your oil change company to determine if there is an unacceptable disparity between workers. Your company’s stated goal is to change the oil in anyone’s automobile within 15 minutes. You decide to set up Xbar – R charts. Your plan is to sample 20 days and record the performance of 5 randomly selected workers.
Calculating 3 Sigma Control Limits
Using the information below, calculate the proper control charts limits.
Control limits for the X-bar Chart.
UCL= x̅̅ + A2 (R̅)
LCL = x̅̅ – A2 (R̅)
Control limits for the R-chart.
UCL = D4 (R̅)
LCL = D3 (R̅)
Grand mean (for mean of Xbars) = 15.11
R-bar (mean of Ranges) = 6.4
D3 = 0
D4 =2.114
A2 = 0.577
Lets review the 6 tasks below and how to solve them
a. Calculate the upper control limit for the X-bar Chart
b. Calculate the lower control limit for the X-bar Chart
c. Calculate the upper control limit for the R-chart
d. Calculate the lower control limit for the R-chart
e. If your data collection for the X-bar is 17.2, would the process be considered in or out of control?
f. If your data collection for the R-bar is 13.98, would the process be considered in or out of control?
Now, let us calculate the X-bar Chart limits from problem (a) & (b)
a. LCL: x̅̅ – A2 (R̅) = 15.11 – (0.577 x 6.4) = 11.42
b. UCL: x̅̅ + A2 (R̅) = 15.11 – (0.577 x 6.4) = 18.8
You can see that in the middle between these two numbers you have the average of 15.11. Now, this is for the X-bar Chart.
Let us calculate for the UCL and LCL for the R-chart in problem (c) & (d)
c. UCL = D4 (R̅) = 2.114 x 6.4 = 13.53.
d. LCL = D3 (R̅) = 0 x 6.4 = 0
So now, these are our upper and lower control limits for the range (the variations in this process).
To answer the Question (e): since 17.2 is within our calculation of the X-bar collection yields (11.42 – 18.8), therefore we would say that 17.2 means the process is in control which is a common cause and not special cause variations.
Now for the final Question (f): Since 13.98 is outside our calculation of the R-bar control limits (0 – 13.53), therefore we would say that 13.98 means the process is out of control and requires investigation.
Conclusion of 3 sigma control limits
There are some reasons why companies use SPC. Often someone within the organization initiates the use of control charts and other SPC techniques to reduce variation and to improve manufacturing processes. Many organizations implement SPC to satisfy customer requirements or to meet certification requirements.
SPC is applicable in a wide range of organizations and applications, including non-manufacturing. Control charts can be used for far more than just checking the status of a process; they are also used as an investigative monitoring tool to bring and test ideas to find solutions to problems in the operations.

