What is ABC Analysis
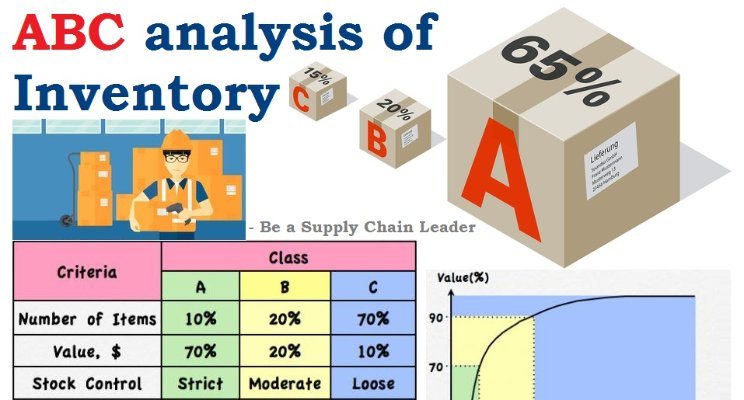
When we talk about ABC analysis steps in light of Inventory optimization in supply chain, it means a method of inventory categorization in which items are divided into three classes A, B and C. A indicates the most important items and C indicates the least important ones.
Objective of ABC Analysis
The basic objective of this approach is that managers must considerably pay attention on the significant few known as ‘A-items’ instead of the various insignificant known as ‘C-items’. Basically the method of ABC inventory categorization provides us with the answers of two main questions by resolving the value of items and, consequently, letting diverse levels of control derived from the relative significance of items.
The majority of business organizations hold a huge quantity of items in their stock. It is helpful to categorize the items in relation to their relative value in order to have improved level of control in a cost-effective way. Generally, this is anchored in annual rupee usage; however additional criteria can be utilized. As mentioned earlier, lots of business entities comprise of thousands of items in their stock. On the other hand, according to the findings of different evidences we can observe that approximately 10% of the items in the majority of companies’ inventory make up 50% of the annual rupee inventory cost. More to the point, an additional 20% of the items make up 30% of the cost. The left over 70% of the items seems to make up just 20% of the cost. In that order these have been classified as A, B and C categories. As a result, it forms our ABC system for the inventory management. Lets continue with the ABC analysis steps.
ABC Analysis Steps
- The ABC system affirms that a business entity must rate items in the range of A to C during inventory evaluation, basing its rankings on these rules where A-items are considered as goods in which yearly consumption value is greatest. With an average use value, B-items are considered as the interclass items. So that 15-25% of annual use value normally comprise 30% of the entire stock items.
- With the help of a formula the yearly consumption cost can be determined which is (Annual demand) x (item cost per unit). Therefore, the supply manager can categorize hot spots of the inventory by means of this classification, and divide them from the remaining items, particularly those items that are abundant but not that money-spinning for the business.
- So the things that have maximum annual usage get the higher rank and the things with minimum annual usage get the lowest rank.
- Those policies that are derived from ABC analysis influence the sales difference summarized by the Pareto principle. This means that all items must get an evaluated management in line with its category. For A-items there must be a strict inventory control, extra protected storage spaces and higher sales forecasts. There must be regular reorders with weekly or even on a daily basis. A main concern and priority task for A-items is to steer clear of being out of stock. When it comes to C-items re-ordering is not observed very much. Normally inventory policy for C-items comprises simply 1 unit readily available, and of reordering just in case when a valid purchase is completed. Because the C-items shows both low demand and greater risk of unnecessary inventory expenses, this technique causes stock-out position followed by all purchases that can be a suitable condition. So for C-items, the main query is not about how many units must be kept in store. However to a certain extent what needs to be considered is that do we even need to maintain this article in store? As far as B-items are concerned they facilitate from an intermediary category between A and C. An essential feature of ‘B category’ is the examining of possible development to ‘A category’ or, in the opposite sense which means toward the ‘C category’.
Dividing items in A, B and C category is comparatively random. This classification just stands for a quite simple explanation of the Pareto principle. In reality, the amount of sales is not the single metric that evaluates the item value. However the influence of a stock-out on the client business must affect the inventory strategy as well.
