Value stream map is a visual mean to portray and improve the flow of a manufacturing and production process, as well as the information that controls the flow of materials through the process. In this article we will review how to create a value stream map.
A value stream map will take into account not only the activity of the product but the management and information systems that support the primary process. Therefore, it is a tool that helps organisations identify and minimize waste in a process. You will gain insight into the decision making flow in addition to the process flow. The basic idea is first to map the information flow that enables the process to occur.
Value stream mapping helps to identify workflow inefficiencies as for example, time spent hunting for patient charts or tracking down a doctor for an exam room and implement improvements. There is a kind value stream map called high level outline that can improve the workflow efficiency for physicians. Of course you may edit it and create your high level framework.
Preparing to Create a Value Stream Map
There are fundamental processes to know when looking at how to create a value stream map, but you need to spend time observing your company process before you can visualize it. Keep these tips in mind as you perform your value stream analysis.
Talk to leadership first. Make sure you understand the goals of your key stakeholders and consider these aims as you choose a process to analyze.
Observe the process and collect data. Ask your colleagues to walk you through the existing process. Some process engineers start at the end of the process. Record the time it takes to complete each step and record any spots of inefficiency. Data could include items as the number of workers, number of working hours, size of each batch, machinery uptime and downtime.
Record the current state first and then move to a future state. Document your process as it is so you can demonstrate any issues. After you have created that value stream map, you can create others to show typical workflows.
How to Create a Value Stream Map
Understand how to walk through your process and gather the data you need, know how to do a value stream map and start analyzing your process. Below are the steps on how to create a value stream map.
01 Determine the Scope of Your Value Stream Map
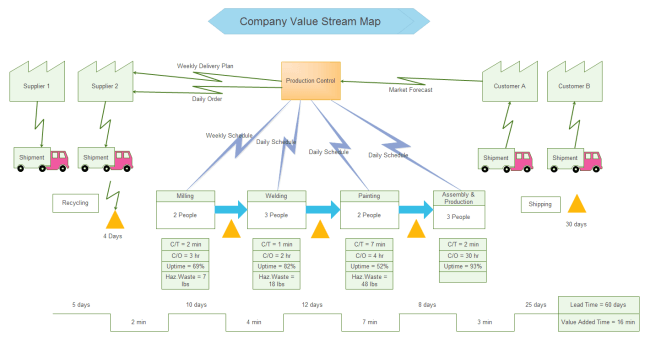
Create your start and endpoint first and place them in your top left and right corners of your document. If you cover the entire supply chain, you will likely start with the supplier/raw material and end with the costumer. Use a pointed shape to represent these points.
Next to the customer you will record your takt time or the maximum amount of you can spend while still satisfying costumer demand. To calculate this number, take the available minutes for production and divide it by the required units of production.
02 Map the Steps of Your Process
Add process boxes to show all the steps involved. In the corner of each process box, a small circle indicates how many operators complete this step in the process. Below each process box include a data table for your analysis. These tables can include, but are certainly not limited to, the following data.
- Cycle Time: The time to complete one part.
- Changeover Time: The time to switch product type.
- Uptime: The percentage of time that the machine is up and running.
- Yield: The percentage of parts that pass inspection.
03 Add Inventory and Wait Times
Now connect your start/end points and process boxes with arrows to show the entire process flow. The dotted arrows, also called bush arrows, represent material shifted from one process to the next.
In between each stage use an inventory triangle to mark the number of parts you have in WIP (work in process) at the end of each step.
04 Draw Information Flow
Value stream maps not only show the production process, but they also display the movement of information throughout that process. Add an output control box to represent the people scheduling and managing production and place people in between the start and end points. In the second half of that box you can add the group responsibilities.
Then place lines of communication. Jagged lines show electronic communication such as email, phone or fax. You can add notes to the type of data exchanged, the frequency of this exchange or the media used. Straight lines show manual communication such as memos, printed reports, or in person conversations.
05 Create a Timeline
Finally you should create a timeline at the bottom of your value stream map. Because value stream maps aim to detect waste in a process, the timeline is perhaps an essential piece.
The timeline has two levels. On the bottom you’ll write down the times for value added processes taken from the data boxes above. On the top you’ll write down the times for non value added processes.
The timeline also includes a data box to the right that combines all this information. It commonly houses the following information.
- Production lead time: The total non value added time from the top of the timeline.
- Value added time: The entire value added time from the bottom of the timeline.
- Process cycle efficiency: The percentage of value added time out of the production period.
Benefits of Value Stream Map
Like in manufacturing, boosting productivity and reducing waste in knowledge work can increase your bottom line. However, the intangible benefits are equally valuable.
Value stream mapping in knowledge work can help your team in following areas.
- Practice system thinking, creating a culture where team members prioritize their activities based on the needs and capacities of the team.
- Improve communication, replacing status updates with higher level discussion that supports essential business efforts.
- Create guidelines and policies to guide employee behaviour even for tacit work, resulting in more efficient communication.
- Enjoy higher job satisfaction due to more effective collaboration.
- Implement and maintain a culture of continuous improvement.
Value stream mapping can also provide leadership with a clearer picture of how work is moving through the system. This visibility into your team’s process enables you to offer the insightful support they need for continuous value delivery.
Conclusion
In conclusion, much of lean thinking in knowledge work starts with applying value stream mapping to any work where there are repeatable processes. This simple intuitive way of viewing work has moved beyond manufacturing to be a useful tool for improving processes across all business functions.
Waste in knowledge work occurs in the hand offs between team members, by collectively identifying and visualizing these hand offs, teams have more control over how work flows through the value stream. This sort of system thinking leads to a culture of continuous improvement that makes teams more productive, with less time wasted in status meeting and more time spent making things happen.