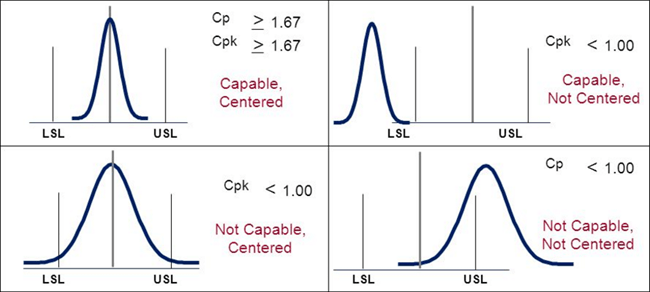
The Cp and Cpk are well known capability indices commonly used to ensure that a process spread is as small as possible compared to the tolerance interval (Cp), or that it stays well within specifications (Cpk).
Another type of capability index exists which is referred to as CPM. This capability index is much less known and used less frequently. The main difference between the CPM and other capability indices is that the bias from the target is directly taken into consideration in the CPM. The bias is the difference between the process average and the target.
In Minitab, as soon as a target is entered into the capability analysis a CPM gets calculated automatically. To obtain a good CPM, a process needs to be right on target, whereas to get a satisfactory Cpk value, a process simply needs to stay well within specifications. This might seem to lead to the same conclusion; however, there is an obvious and significant difference. With the CPM, a direct penalty is incurred for not being exactly on target.
When we speak about the capability of processes we often refer to a couple of indices called Cp and Cpk values. These two indices, used together, can tell us how capable our process is and whether or not we have a catering issue. For the math geeks out there here are the formulas for calculating Cp and Cpk values. The loss function essentially says that the further a product is from the target value, the greater the quality problems encountered by the costumers. This is where the process capability index or Cp comes into play.
Definition of Cp and Cpk Values
Cp is a measure of a process’s ability to meet a specification. The formula for calculating Cp is as follows.
- Cp = (USL – LSL) / 6σ
Where USL is “Upper specification limit” and LSL is “Lower specification limit”
The Cpk index is the position of the total process variation (6σ) in relation to the specification mean. The Cpk associated with the process or a group of items is either the value for Cpu or Cpl, whichever calculation results in the smallest number. The Cpu index is the position of the total process variation (6σ) in the relation to the upper specification limit. The Cpl index is the position of the total process variation (6σ) in relation to the lower specification limit. The following equations define Cpu and Cpl.
- Cpu = (USL – Process Mean) / (3σ)
- Cpl = (Process Mean – LSL) / (3σ)
Under the method of quality acceptance that is currently used by most organizations, the customer determines the requirements for an item and sets up the specified limits within whish an object must fall to be acceptable. Anything falling within the specified limits is considered safe; anything falling outside the limit is bad.
A process capability study involves taking periodic samples from the process under controlled conditions and determining the sample mean and standard deviation. At this point, calculating the Cp and Cpk values will tell you what the yield for the process should be minus the effect of any assignable causes. Comparing the actual return for a process to the expected yield will show how much opportunity for improvement exists in the process.
The key to identification and removal of these assignable causes is careful documentation of the process and any changes that are made to it. Probably the best way to begin reducing the total error present in the process is by listing all sources of error on a Pareto chart starting with those that have the greatest influence on the process. By ranking the sources of error, you will be able to achieve the largest amount of improvement by concentrating on those problems which are most vital. In Pareto terms, it is the “vital few” (20 percent) of the variables that account for 80 percent of the total process error. Whereas the other sources of error are among the “trivial many” (80 percent) of the variables that make up only 20 percent of the total process error.
When designing a new product or process, the goal is to ensure that the process is capable of consistently producing products that meet or exceed the specification requirements. The emphasis is on defect prevention, not detection. The benefits for the manufacturer of designing a highly capable process include higher yields, fewer defects, lower rework cost and less inspection time. The benefits to the customer include better incoming quality levels, less review time and the ability to implement dock to stock or just in time (JIT) delivery procedures.


