
Impact assessment is the way of checking and mapping the activities of an organization as well as determining the importance of changes that are carried out due to those activities. It is a strong mean of communication between the external and internal environment of an organization.
The purpose of impact assessments is to analyze and find out whether a process is meeting the real needs and requirements or not.
Importance of Impact Assessment
Impact assessment is beneficial in assessing the problems that may arise during an intervention and it helps in many ways.
- It helps in assessing the pertinence of the approach that is the current strategies are in concordance with the requirements.
- It helps in interpretation of communication in the organization. It evaluates that the information is passed on effectively in an organization.
- It helps to assess the efficiency of managerial systems in an organization.
- It shows transparency of the operations carried out by an organization.
- It increases the efficiency of the operations taking place in an organization.
- It ensures the quality of process and end product, ultimately results in customer satisfaction.
- It helps to create an error free system by assessing and minimizing the problems.
Impact Assessment tools
Impact assessment tools help to recognize, scrutinize, analyze and appraise qualitative and quantitative data that is pertinent to the operation. For any organization impact assessment tools are most important for any process to be carried out. These tools are helpful in assembling the information regarding that specific process.
Impact assessment tools helps to identify the target market group, Analysis of target market, Responsibilities of personnel and staff, Analysis and evaluation of customer needs. It also helps in assessing different ongoing competitors. It succor in statistical and financial analysis.
These impact assessment tools are needed when you have come up against many facts and ideas in a scattered from. These tools are of great use when dealing with complex and large groups and when group unanimity is essential.
There is many impact assessment or quality management tools for assessment and identification of specific process and information. These tools should be used in combination of two or more for efficient results. Some of them are described below:
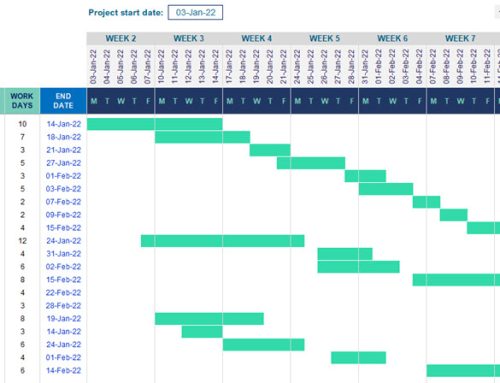
- Tree Diagram: It is a diagram that starts from a central item and divides into several branches with the central item into main focus. Tree diagram is used as a tool when there are several tasks going on simultaneously and it is necessary to identify the ambit of a project. It is used for identification of various hierarchies and inputs and outputs of a project.
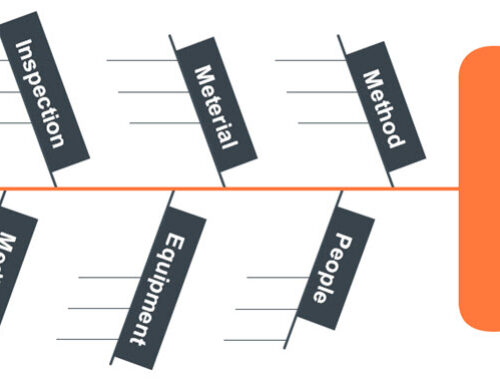
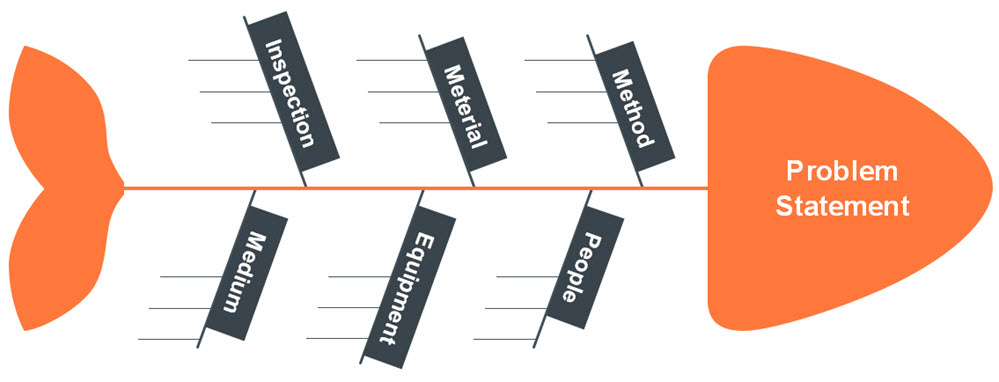
- Cause and effect diagram: It determines various causes of a problem and maps them into a diagram. It is useful in immediate root cause analysis. In five whys methods where there are more than one answers to a specific why fishbone diagram is used for accurate results.
- Histograms: It is a graphical representation of difference of values in different categories of data collected. In simple words it illustrates frequency distribution of data and it helps in comparison of results.
- Check sheet: It is the organized form of data collection and analysis. Data collected is organized against exact time and location. It can be effectively used for different purposes. It is the simplest and most effective way of data representation.
- Pareto Chart: It is also called as bar graph. It is the representation of data collected in form of bars in a specific order in relation to priority. It is helpful when there are various causes of a problem and the most momentous has to be identified.
- Scatter diagram: Also called scatter graph is the graphical representation of data in which one variable is plotted on x-axis and other one on y-axis. The graph is plotted to check correlation between these two variables. It is useful in identification of the direction of relation of two variables, either negative or positive. It is also used to describe cause and effect relationship of two variables. It is useful when there are multiple values of a dependent variable for respective value of independent variable.
- Stratification: Stratification is the arrangement of data into categories and layers. It helps into differentiation of data for easy handling afterwards. It is used for data sampling in statistical analysis when the data has to be collected from various sources.
- Control chart: Control charts are graphical presentation of how data changes in relation to time. It is helpful in monitoring process control and variation. The instability of a process can be analyzed by use of control charts. It has three lines. Upper line is upper control limit, bottom line is lower control limit and middle line is average limit. It identifies whether the process is in control or not by observing these limits. Hence it is concluded that these are very important for the process analysis and assessment and they are quite easy to handle. Computer software can be used for this or simple drawing on paper would help too.

