Statistical Process Control (SPC) is an industry-standard approach for assessing and managing quality throughout the production process. Quality data is acquired in the form of product or procedure capacity right away during production. Setting up Statistical Process Control is a process in itself, calling for organizational dedication across functional limits.
Requirements of SPC
For the first part of our statistical process control tutorial you need to look at the implementation levels. In order to get most promising results one of the foremost requirements is that SPC must be implemented in all organizational levels. We have to apply SPC real-time for controlling a process. For measuring the data has to be registered without any delay to plot the consequences in control charts. When we find that the process is out of control then the root cause of that has to be explored so corrective actions can be taken. If we just evaluate the data at the end of the day it would be of no use as the products already have been produced. Any issues seen at that time is too late to rectify.
Levels of SPC
If you really want to discover the root cause and apply corrective actions then we need to empower the operators. It may happen that they lack the ability of finding the root cause or are not permitted to take the necessary corrective actions. In that case they must notify the support level of production and it is their duty to develop the process inputs and give feedback to the operators in which way the process is improved. This is called as the improvement level. Proper and realistic targets must be formed from the production management to achieve continual improvement in that way priorities can be established accordingly. They must be responsible for providing the means as well that can improve the production aspects. This is referred as the planning level. Now let’s move on to the implementation part of the statistical process control tutorial.
Statistical Process Control Tutorial for Implementation
For the implementation of SPC there are different steps.
The first implementation step of the statistical process control tutorial is to define the methods for measurement purposes. As SPC is founded on the data analysis, so it must be decided at that initial stages that what data must be collected. Variable or Attribute is the two types of control chart differentiated by the type of data used. Variable data derives from measurements on a continuous scale, for instance: weight, time, temperature, and distance. Attribute data is established from discrete differences like percentage defective, number defective per hundred, and good/bad. Secondly the measurement system has to be qualified as it holds a critical value but often it is an ignored step in this process. There is no measurement system which does not have any measurement error. More to the point, if that error goes beyond a standard level, we cannot act upon the data dependably.
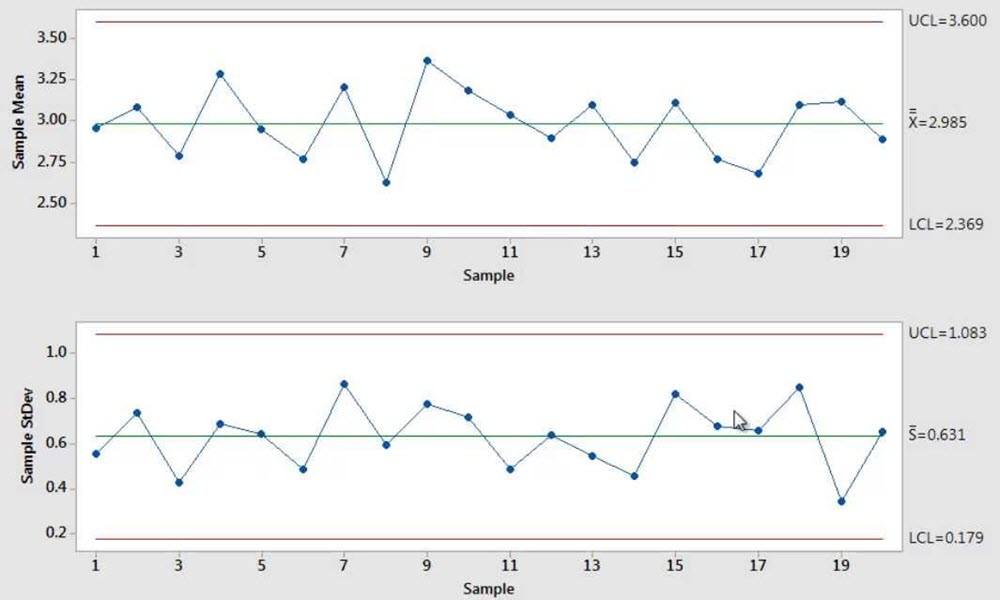
In addition to that the data collection must be started along with the SPC Charting. In order to collect data, a sampling plan must be developed in a random way at a determined rate. It must be made sure that the data collectors are properly trained in accurate measurement and charting methods. Subgroups must be created following a sub grouping strategy which has to be rational so that process discrepancy is taken between subgroups instead of within subgroups. If we find that the process variation is caught within one subgroup, the consequential control limits will be broader, and the chart will be indifferent to process changes. The form of chart used will be reliant on the kind of gathered data along with the subgroup size.
Furthermore, we will need to develop and document reaction plan. All processes that are charted must hold a clear reaction plan guiding the actions to those personnel who’re using the chart in the occurrence of an out-of-control or out-of-specification situation. A control plan must be kept that covers all relevant information on each charts being maintained. Moreover, in order to fit local needs the control plan can be adjusted. After 20-25 subgroups the control limits must be calculated followed by evaluating control.
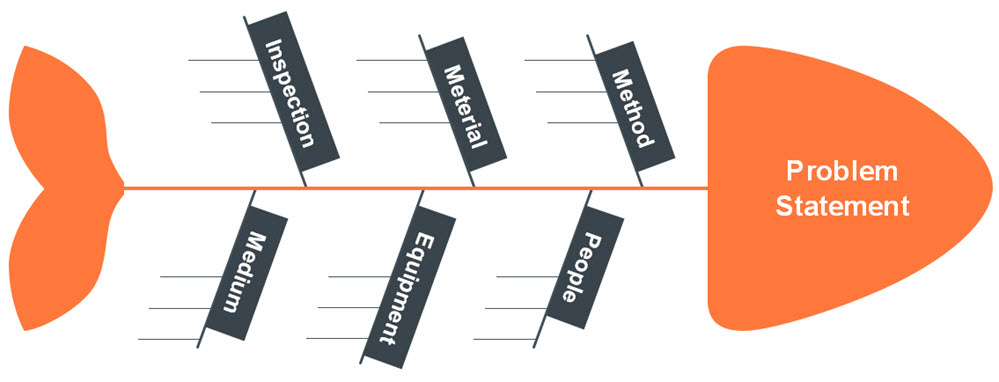
Once the control limits have been established, the next step is to evaluate whether or not the process is in control which means being statistically even over time. In case an out-of-control situation is observed, the resulting step is to assemble and explore data to detect the root cause. In addition to that, for improving process competence level we have to design and implement proper action plans. After calculating the Cp and Cpk, they are compared with the established benchmark for observing and focusing our efforts on the afterward highest priority.