Cause and Effect
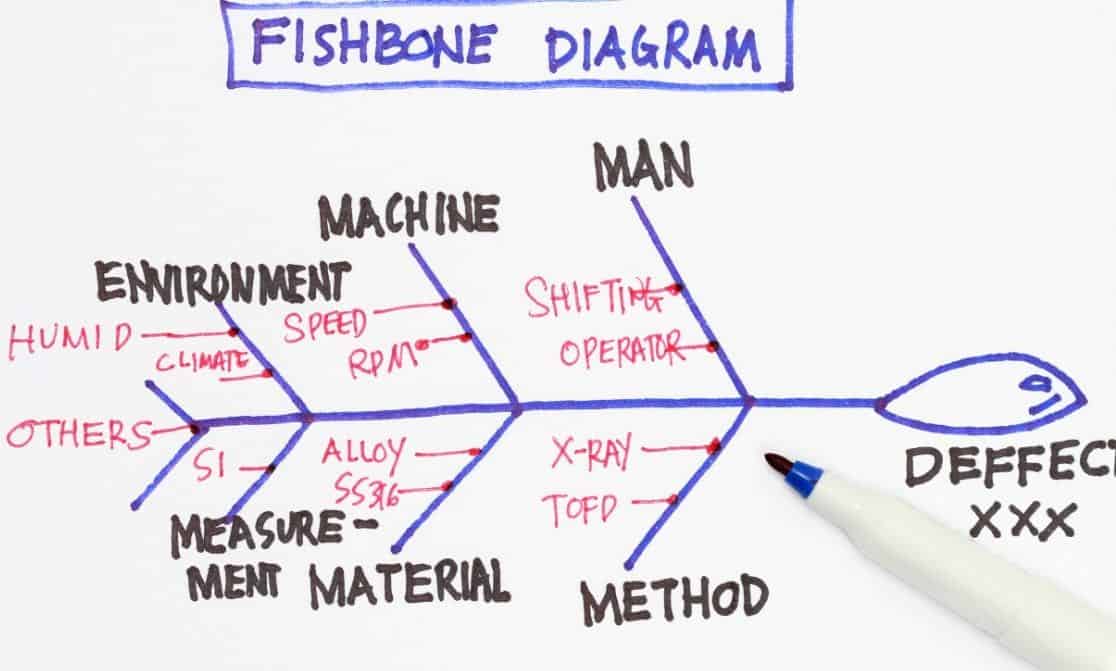
Undoubtedly every person and organization have their own share of problems and they can take place expectedly and unexpectedly in different forms. An important factor is that we are able to identify the root cause of these problems in an appropriate manner. To put it simply, a fishbone diagram is a diagram giving the impression of the skeleton of a fish. This diagram also goes under the name “cause and effect diagram” and basically this is the main and actual purpose for which it is used. So, it implies the fact that we use fishbone diagram at work to find out the leading causes of a problem at hand. Here, the problem which is going to be considered is referred as the effect. Fishbone diagram symbolizes the possible causes of a problem in visual form being explored by any organization or a person.
Background
It is known as Ishikawa diagrams as the fishbone diagram was originally created by Dr. Kaoru Ishikawa in 1943 at the University of Tokyo. There are also some other names of this diagram such as “Herringbone diagram” and “Fishikawa diagram”. It is important to know that this cause and effect analysis tool is considered as one of the seven essential quality tools. Likewise, it has grown as a noteworthy measure of numerous existing systems which also comprises of Six Sigma. In the beginning a fishbone diagram was believed to be benefiting in finding the solution of the key problem. Nevertheless, the tool helps in accomplishing the purpose which is not confined to simple problem solving only. The fishbone diagram can be quite useful for breaking down all causative components in a hierarchical form.
Development Stages
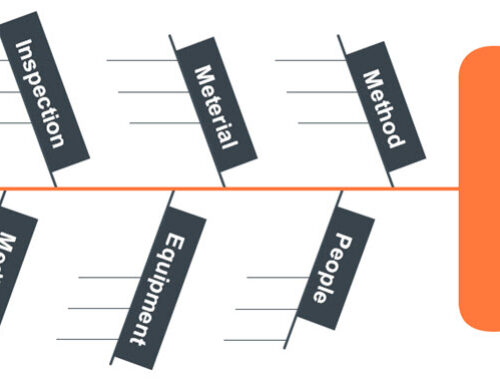
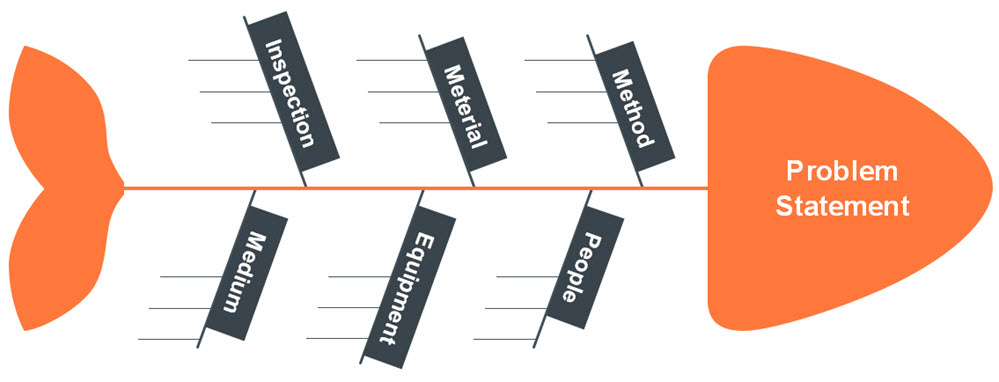
When to use a fishbone diagram can be considered if an effective tool for root cause analysis and problem solving is required. There are some important steps in the creation of a fishbone diagram and they must be performed carefully as it can compromise the entire effort. We can draw this diagram on a single paper sheet or on a whiteboard in case it involves a team. The starting step is to identify a problem where a possible solution is required. At the mouth of the “fish” the problem is stated. The next step is to locate the main categorizations of causes which are detailed as branches scattering from the arrow of this tool. As a third step, we determine “Why does this occur?” about every probable cause.
When to Use a fishbone Diagram at Work
When it comes to our problem at hand, we must continue to explore the causes as well as sub-causes in a systematized approach that explains the ‘why’ element to the potential sources. This effort must be continued until we can’t come up with any other prospective reasons. Ultimately an organized way will be accomplished by us as well as our business by means of this cause and effect analysis which will help in the understanding of all possible causes of our problem. In the same way it will make an easy way for us to define a solution. Now this final form of fishbone diagram can be put into any report or presentation at work. When the fishbone diagram is finalized, then it can be printed or exported to different file formats so in that way, we can share it with others at work.
So if you ask yourself when to use a fishbone diagram, it depends on us how we choose to use it at work. However, if you or your organization considers implementing quality management and is not making use of one of the seven essential quality tools like the fishbone diagram, then for sure you are missing out on all of the benefits it provides during problem solving.


