A uniform product having very low defect rate is usually given by a capable process. The comparison of yield of an in control process with the specified limits is called as manufacturing capability. It is also known as process capability. Manufacturing capability and defect rate are inversely proportional to each other. Thus, the higher the manufacturing capability, the lower the defect rate will be. There are different surveillance stages in a manufacturing process through which the product passes while manufactured. These stages ensure that the product is uniform and has no defects. However, if the process capability is higher then there is no need of such surveillance stages.
Apart from quality improvement, manufacturing capability of a process also has financial significance. As the capability improves, there is more space to establish product specifications. As the manufacturing capability improves, it lowers the requirement of repair or redesign and also minimizes waste.
Manufacturing Capability of a Process
A process can be defined as a sequence or series of steps or procedures that utilize different resources and transform statistics into yield. All the steps in a process add up to produce the required product. However, there can be different variations in a process. These variations cannot be eradicated on the whole, but they can be minimized. Variations can be minimized by using credible and persuasive equipments and process controls. Thus manufacturing capability can be maintained in this way.
Manufacturing capability of a process or process capability is usually represented by Cp. It is one of the factors that describe how our process is operating. Other factors are process capability index (Cpk), process performance capability index (Ppk) and process performance capability (Pp). Calculations for manufacturing process capability (Cp) and process capability index (Cpk) utilize mean deviation in subgroups whereas Pp and Ppk utilize standard deviation among whole population.
The outcome of a process or operation is compared to the specified limits with the help of process capability indices that are Cp and Cpk. The specified limits are established by tolerance range. Cp determines the capability of a process to remain within specification limits. On the other hand Cpk evaluates if the process is within specified range.
Why Manufacturing Capability Should be Determined
In this era of overgrowing business competition, it is requisite for every business to provide high quality products with minimal defects and waste. From a broader perspective, process capability is a part of statistical process control (SPC). Statistical process control includes the collection and analysis of data for better understanding of process performance and detection of variations. Therefore, manufacturing capability is determined for evaluation of the manufacturing performance of a process so it can be adjusted according to customer requirements.
Determining Manufacturing Capability of a Process
From a conceptual perspective, process capability is the ratio of voice of customer (VOC) to voice of process (VOP). It illustrates process performance in relation to customer’s requirements that whether the process is performing as expected or not. If all the measurements and readings of a process falls within the specification limits that process is referred to as a capable process.
Generally, the comparison is made between the outcomes of a process with the specified limits and a statement is given about how capable a process is performing. As discussed earlier, the manufacturing capability of a process can be calculated by the capability indices i.e Cp, Cpk, Pp, Ppk etc.
It is assumed that the data values have a normal distribution. µ is the mean deviation and is the standard deviation. The manufacturing process capability can be calculated by the following equations:
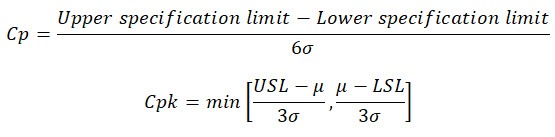
Cpk can also describe as;
![]()
Where, k is the distance among the center of specification limits.
For example, let’s take the measurements from a part of machine randomly because randomly collected data represent the population values better. In this example, the data is variable and data consist of 150 measurements.
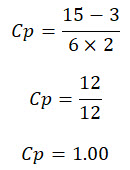
Upper specification limit is 15
Lower specification limit is 3
Standard deviation is 2
Cp can be calculated as
Center point, m, can be calculated as follows:
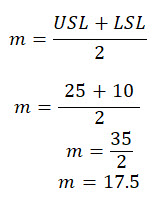
It means the process is capable until it is located at center point 17.5.
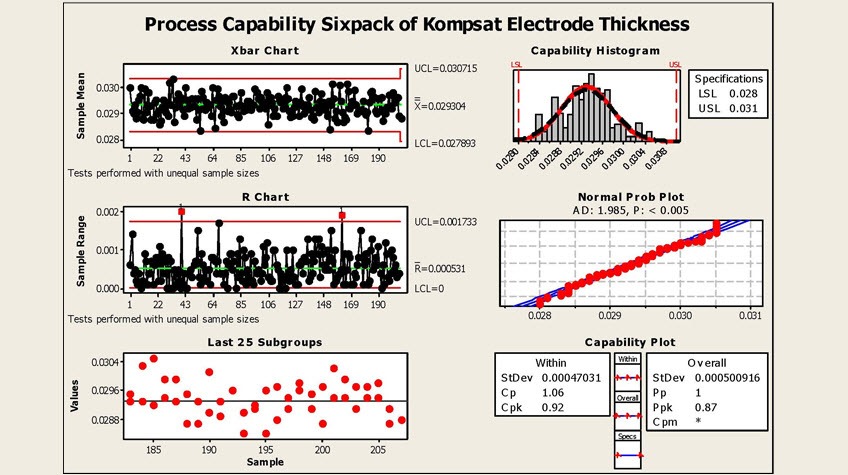
Manufacturing capability of a process can further be explained by using a graph by comparison of range of specifications to the range of data calculated.


