Becoming a Certified Internal Auditor
An auditor having a professional certification from a registered institute is known as a Certified Internal Auditor (CIA). The internationally recognized institute for this certification is The Institute of Internal Auditor that has more than 175,000 members and is acceptable worldwide. If a person wants to pursue their career [...]

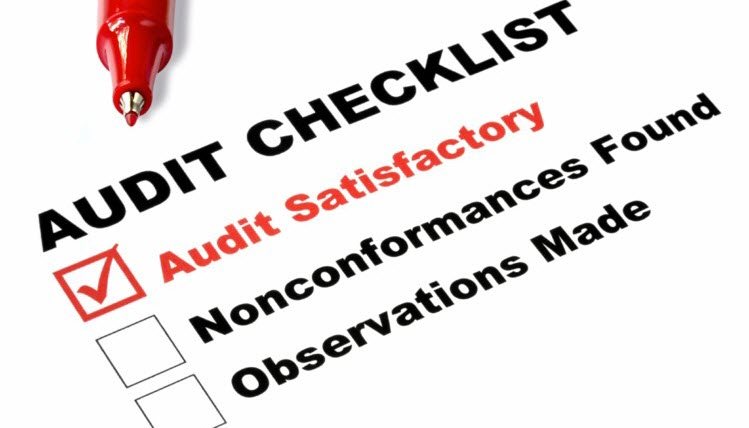
Benefits of Using Supplier Audit Within an Organisation
Some suppliers react negatively when a supplier audit is requested by one of their customers. A supplier audit could evolve around compliance if fire doors installed in a building to controls in place when manufacturing a mobile phone. You may hear a supplier say something as "we do not [...]

The Steps in Continuous Improvement Process
Each organization, small, or big, is showing interest in continuous improvement and always showing signs of improvement to meet both external and internal needs. There are some standard, extremely straightforward continuous improvement processes that are utilized by companies. Gathering ideas from employees in an employee suggestion program is extraordinary [...]
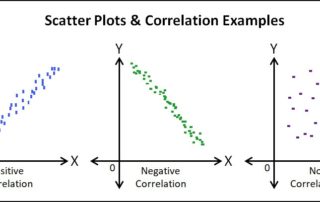
Interpreting a Scatter Plot and When to Use Them
A scatter plot is a two-dimensional data representation that uses dots to show the values acquired for two different variables, one plotted along the x-axis and the other plotted along the y-axis. For instance this scatter plot below demonstrates the height and weight of a fictitious set of children. [...]
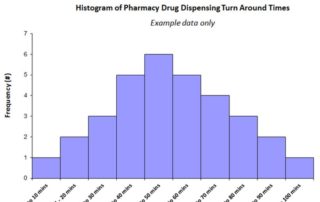
How to Draw a Histogram and When to Use It
Histograms are like bar charts; they are an approach to show counts of information. A bar graph charts counts against categories; the height of the bar shows the quantity of things in that classification. A histogram shows the same unmitigated factors in "bins". When you make a histogram, you [...]

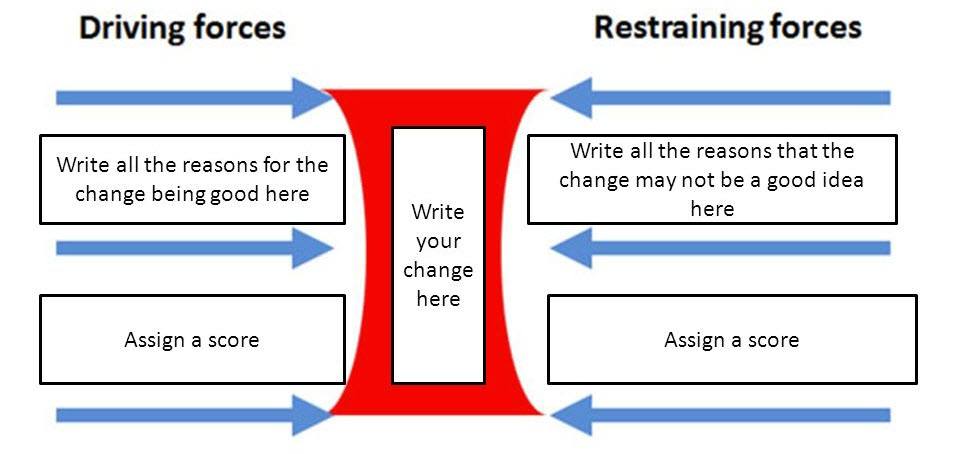
Lewin’s Force Field Analysis Used for Change Management
Lewin’s force field analysis is a strategy which can be used to identify, discuss and document the elements that oppose or support a change initiative. This analysis was invented by Kurt Lewin, a social psychologist in the 1940s and it is often applied to the making of a ‘yes’ [...]