Introduction
Value stream mapping (VSM) is a tool used in lean manufacturing to minimize the waste (increases efficiency and value production). Lean manufacturing is fully about minimizing waste and adding value to your products and services. Value stream mapping starts with analyzing the current state which is how the organisation currently delivers its products or services and then it improves that process. The areas of waste in current state are identified to be able to refine and improve the processes.
To develop value stream maps representing the current and future ideal state, you start with creating a diagram and schematic that illustrate the flow in the company’s production processes. The flow start from the organisations suppliers and end end with their customers. The value stream map of an organisation must consist of three different tiers that represent:
- The flow of information
- The production processes
- Timeline
Although value stream mapping often is associated with manufacturing, it is applicable in the majorityof industries such as, but not limited to:
- Kind of manufacturing facilities
- Supply chain and logistics
- Software development
- Healthcare facilities
- Office works
- Tourism industry
Value Stream Mapping Diagram
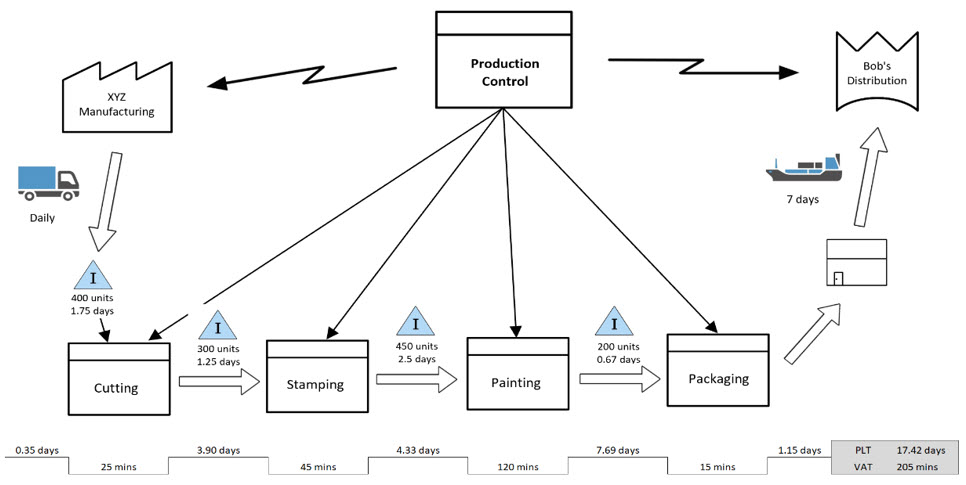
The purpose of the the value stream mapping diagram is to provide visual illustration of the processes to better understand what is included in the process and identify and remove non value adding steps and activities. This is also known as MUDA (Japanese language for waste). An example of a value stream map is seen below.
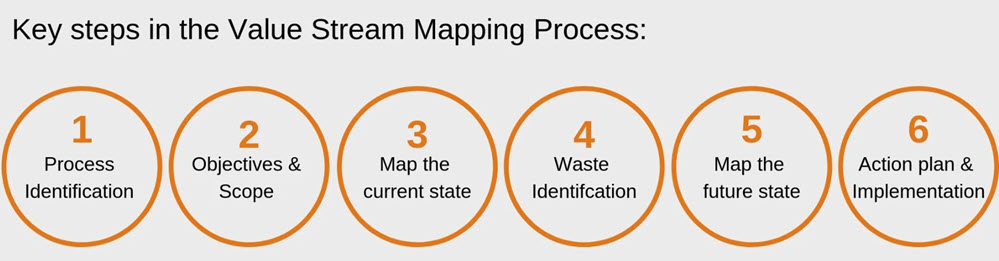
Value Stream Mapping Tutorial Steps
Following are the steps to take during this value stream mapping tutorial:
- Set-up production control system
- Add suppliers
- Add customers
- Define the processing steps
- Include transport needs
- Develop the inventory requirements
- Estimate value-added time
- Estimate production lead time
Set-up production control system
In the first part of this value stream mapping tutorial production control need to be added. The production control helps in managing production. This plays a role of the coordination in production operations which are characetrized in value stream mapping. The typical production control’s standard location on a the value stream map is in the top area and centred.
Add suppliers
Almost all industries require raw materials as inputs which are processed to deliver the output. These raw inputs arrive at incoming and passes through several rounds of processes before it has its final shape and can be delivered to the customer.
On the value stream map, the inputs is typically added in the top left corner. That includes suppliers whose materials is receive and turned into the final product.
Add customers
The final product that leaves the processing plant is dispatched to external customers. It can be individual people or an organization that receive the deliveries of products. The customer are typically located in the top right corner of the value stream map.
Define the processing steps
The processing steps are typically defined at the bottom of the value stream map. Every process needs to add value and is incorporated with a label defining the process e.g. painting. For the process steps it is not important how big or complex a work station is, The only important factor is if that piece of the chain add value.
Include transport needs
In this part of the value stream mapping tutorial the transportation of products throughout the value stream map is shown by the mode of transport and frequency in transportation. E.g an illustration of a truck with the indication ‘daily’.
Such information must be placed on value stream map whenever a shipment is transported between physical plants.
Develop the inventory requirements
Inventory is shown on value stream map by a triangle shape encasing the capital letter I. Two types of information must be given below the symbol
- Average no. of units stored.
- The average time the units spend there.
This method allows the quick assessment of industry inventories, E.g. if it is noted that 450 unites are stored with an average time of 2.5 days. This information will be placed at location of map where the inventory accumulates.
Estimate value-added time
VAT (Value Added Time) shows the amount of time that products spend at each production station, and it can be measured from the time of raw material arrive at station to the time a final product is ready to be shipped. It does not include the time the material is waiting for processing, either before or after.
On the value stream map, a jagged line is added below each production step. The bottom parts for production and upper parts for inventory. The VAT of every process is recorded on the line as seen in the above picture.
Estimate production lead time (PLT)
PLT is time in which the products spend waiting in inventory among production steps. This could be different storage location or directly at the line of assembly between stations. The PLT is represented on value stream map in upper parts of the jagged line.

