Balanced Scorecard Steps to Take During Implementation
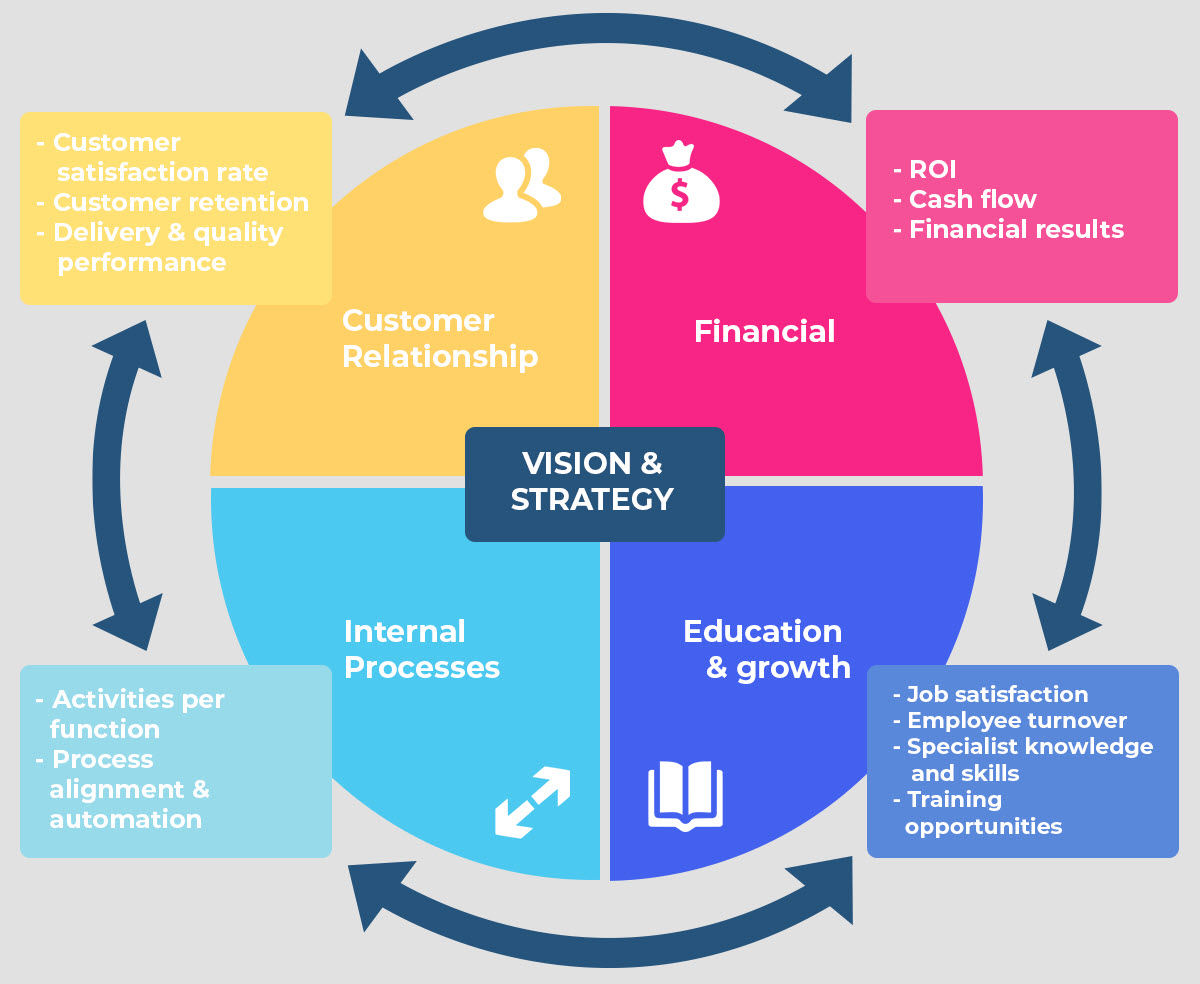
What is a balanced Scorecard? The Balanced Scorecard is basically a strategic planning and reporting technique, that captures the objectives of an organization and divides them between four perspectives that hold equal significance. These include financial, customer, operational, and people perspective. In order to provide a clear course of implementation the organizational objectives cascade [...]


